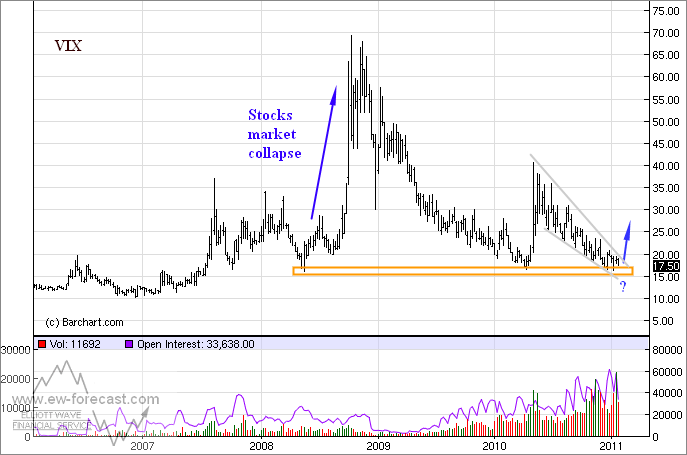
Below we can see VIX chart. This is a volatility index of the S&P500; actually measures an “investor’s fear” in current market conditions. The greater the fear is, the higher the VIX level will be. If the fear decreasing in the market than you will see VIX falling; like in our case. The results of course, are higher stock prices; higher S&P500. VIX is at very low price right now, and S&P 500 is very high, so we can say that trade is “overcrowded”, because there is no fear in the market and a lot of investors are buying it. But as you know, usually when something is overcrowded the opposite reaction follows. In our case this would be on the upside.
From a technical perspective, we can see a triangle on VIX chart before market fell into a new low. But since the VIX is in a downtrend we know that triangle can be placed only in wave 4, because triangle can never appear in wave 2.
And here is the next important fact from an Elliott Wave perspective: “triangles unfold just prior to the final move in the larger pattern”. So, wave 5 must be a final move as shown on our chart, which means that reversal from the lows should follow in the near term; at least into a higher correction, because after every five waves temporary change in trend occurs!
So, if we are on the right track here, then top on the S&P500 is also near. Market is currently testing 13000 psychological level…

In 2008, before the stock market collapsed VIX hit the lows around 16.

If you need more Elliott Wave forecast, especially on the intra-day basis, please visit our website and check Video Tour of Our Products here.


